You are here
Europe (Baseline)
Soil loss by water erosion in Europe
Soil erosion by water is one of the major threats to soils in the European Union, with a negative impact on ecosystem services, crop production, drinking water and carbon stocks. The European Commission’s Soil Thematic Strategy has identified soil erosion as a relevant issue for the European Union, and has proposed an approach to monitor soil erosion. A recent published paper presents the application of a modified version of the Revised Universal Soil Loss Equation (RUSLE) model (RUSLE2015) to estimate soil loss in Europe for the reference year 2010, within which the input factors (Rainfall erosivity, Soil erodibility, Cover-Management, Topography, Support practices) are modelled with the most recently available pan-European datasets. While RUSLE has been used before in Europe, RUSLE2015 improves the quality of estimation by introducing updated (2010), high-resolution (100 m), peer-reviewed input layers. The mean soil loss rate in the European Union’s erosion-prone lands (agricultural, forests and semi-natural areas) was found to be 2.46 t ha-1 yr-1, resulting in a total soil loss of 970 Mt annually. A major benefit of RUSLE2015 is that it can incorporate the effects of policy scenarios based on land-use changes and support practices. The impact of the Good Agricultural and Environmental Condition (GAEC) requirements of the Common Agricultural Policy (CAP) and the EU’s guidelines for soil protection can be grouped under land management (reduced/no till, plant residues, cover crops) and support practices (contour farming, maintenance of stone walls and grass margins). The policy interventions (GAEC, Soil Thematic Strategy) over the past decade have reduced the soil loss rate by 9.5% on average in Europe, and by 20% for arable lands. Special attention is given to the 4 * 106 ha of croplands which currently have unsustainable soil loss rates of more than 5 t ha-1 yr-1, and to which policy measures should be targeted.
Update 2016.Five years after the assessment of soil loss by water erosion in the EU [Environmental science & policy 54, 438–447 (2015)], we present an update of the EU assessment of soil loss by water erosion for the year 2016. The estimated long-term average erosion rate decreased by 0.4% between 2010 and 2016. This small decrease of soil loss was due to a limited increase of applied soil conservation practices and land cover change observed at the EU level. The modelling results suggest that, currently, ca. 25% of the EU land has erosion rates higher than the recommended sustainable threshold (2 t ha-1 yr-1) and more than 6% of agricultural lands suffer from severe erosion (11 t ha-1 yr-1). The results suggest that a more incisive set of measures of soil conservation is needed to mitigate soil erosion across the EU. However, targeted measures are recommendable at regional and national level as soil erosion trends are diverse between countries which show heterogeneous application of conservation practices.
The new soil loss by water erosion map of Europe uses a modified version of the RUSLE model (RUSLE2015, based on Renard et al., 1997), which calculates mean annual soil loss rates by sheet and rill erosion according to the following equation:
E = R * K * C * LS * P
Where
- E: Annual average soil loss (t ha-1 yr-1),
- R: Rainfall Erosivity factor (MJ mm ha-1 h-1 yr-1),
- K: Soil Erodibility factor (t ha h ha-1 MJ-1 mm-1),
- C: Cover-Management factor (dimensionless),
- LS: Slope Length and Slope Steepness factor (dimensionless),
- P: Support practices factor (dimensionless).
The RUSLE2015 model introduces some improvements to each of the soil loss factors, adapting them to the latest state-of-the-art data currently available at the European scale.

Input layers for the estimation of soil loss factors for Europe in RUSLE2015.
Rainfall erosivity factor (R): R-factor is calculated based on high-resolution temporal rainfall data (5, 10, 15, 30 and 60 minutes) collected from 1,541 well-distributed precipitation stations across Europe. This first Rainfall Erosivity Database at the European Scale (REDES) was a major advancement in calculating rainfall erosivity in Europe. The precipitation time series used ranged from 7 to 56 years, with an average of 17.1 years. The time-series precipitation data of more than 75% of European Union (EU) countries cover the decade 2000-2010. Gaussian Process Regression(GPR) (Rasmussen and Williams, 2006 )has been used to interpolate the R-factor station values to a European rainfall erosivity map at 500m resolution. The covariates used for the R-factor interpolation were climatic data (total precipitation, seasonal precipitation, precipitation of driest/wettest months, average temperature), elevation and latitude/longitude. The mean R-factor for the EU plus Switzerland is 722 MJ mm ha-1 h-1 yr-1, with the highest values (>1,000 MJ mm ha-1 h-1 yr-1) in the Mediterranean and alpine regions and the lowest (<500 MJ mm ha-1 h-1 yr-1) in the Nordic countries.
Soil erodibility factor (K): K-factor is a lumped parameter that accounts for the reaction of the integrated annual soil profile to the process of soil detachment, and transport by raindrops and surface flow (Renard et al., 1997). In RUSLE2015, the K-factor is estimated for the 20 000 field sampling points including in the Land Use/Cover Area frame (LUCAS) survey. Following the Wischmeier and Smith (1978) nomograph, the K-factor uses five soil parameters as inputs: texture (silt, clay, sand fraction), organic matter content, coarse fragments content, permeability, and soil structure. The mean K-factor for Europe was estimated at 0.032 t ha h ha-1 MJ -1mm-1 with a standard deviation of 0.009 t ha h ha-1 MJ -1mm-1. The yielded soil erodibility dataset compared well with the published local and regional soil erodibility data. However, the incorporation of the protective effect of surface stone cover, which is usually not considered for the soil erodibility calculations, resulted in an on average 15% decrease of the K-factor.
Cover-Management factor (C): C-factor estimation is differentiated between arable and non-arable lands. For all non-arable lands, the C-factor is determined mainly by vegetation. Non-arable lands cover ca. 75% of the EU. The CORINE Land Cover database was used to derive the different land-use classes of non-arable lands in Europe, and to assign a range of C-values for each class. Using biophysical attributes such as vegetation-coverage density (derived from remote-sensing datasets of the Copernicus Programme), a C-value was assigned to each pixel based on the combination of land-use class and vegetation density. For arable lands, the C-factor was estimated using crop statistics from the EU’s Statistical service (Eurostat) and assigning the C-factor values per crop type based on an extensive literature review. In addition, the effect of some management practices on soil loss rates was quantified at the European scale for the first time ever. The calculation of the C-factor of arable lands included soil-tillage practices, cover crops and plant residues.
Topographic factors - slope length (L) and slope steepness (S): LS-factor is calculated using the equations proposed by Desmet and Govers (1996). The LS-factor dataset was calculated using a high-resolution (25 m) Digital Elevation Model (DEM) for the whole European Union (Eurostat, 2014), resulting in an improved delineation of areas at risk of soil erosion as compared to lower-resolution datasets. The LS-factor data are available for download in 2 resolutions (25m, 100m) from the European Soil Data Centre (ESDAC).
Support practices factor (P): P-factor takes into account: a) contour farming implemented in EU agro-environmental policies, and the protection against soil loss provided by b) stone walls and c) grass margins. The P-factor was estimated using the latest developments in the EU’s Common Agricultural Policy (CAP) and applying the rules set for contour farming over a certain slope gradient derived from the Good Agricultural Environmental Condition (GAEC) requirements. The 270,000 field observations of the Land use/cover area frame statistical survey (LUCAS, 2012) were used to model the presence and density of stone walls and grass margins (van den Zanden et al., 2013). The mean P-value for the EU was estimated at 0.97, while in agricultural lands it was estimated at around 0.95.
Data
The soil erosion data (year: 2010, 2016) are available to the public user as GIS datasets. In case you need aggregated data, then you can download the soil erosion indicator
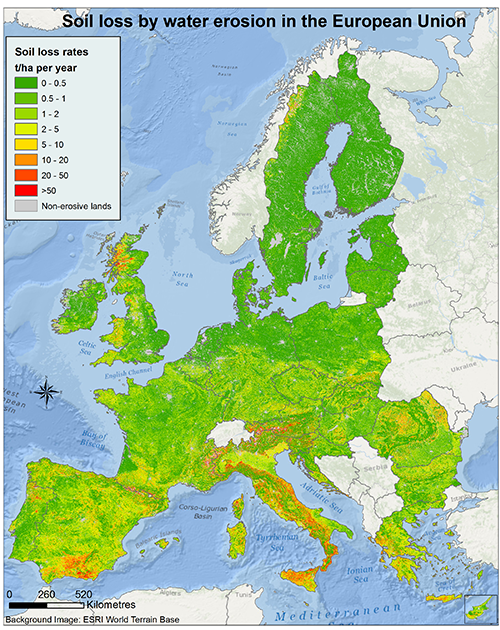
Fig. 2: Soil loss by water erosion in European Union
Soil erosion by water accounts for the greatest loss of soil in Europe compare to other erosion processes, such as wind. Agricultural lands account for 68.3% of total soil losses, while forests account for less than 1%. Around 12.7 % of arable land in EU is estimated to suffer from moderate to high erosion. This equates to an area of 140,373 km².
The soil loss by water erosion map (Fig. 2) delineates areas of concern that will require special protection measures, such as financing more sustainable land management practices. The authors recommend that soil protection measures focus on the 24% of EU lands that experience an average annual soil loss of two tonnes per hectare. According to the soil erosion map (fig. 2), approximately 11.4 % of the European Union (EU) territory is estimated to be affected by a moderate to high level soil erosion (more than 5 tonnes per hectare per year).
According to future land use scenarios, RUSLE2015 estimates that rates of soil loss by water will incease in the rate of 13-22.5% by 2050, mainly due to an increase in erosivity.
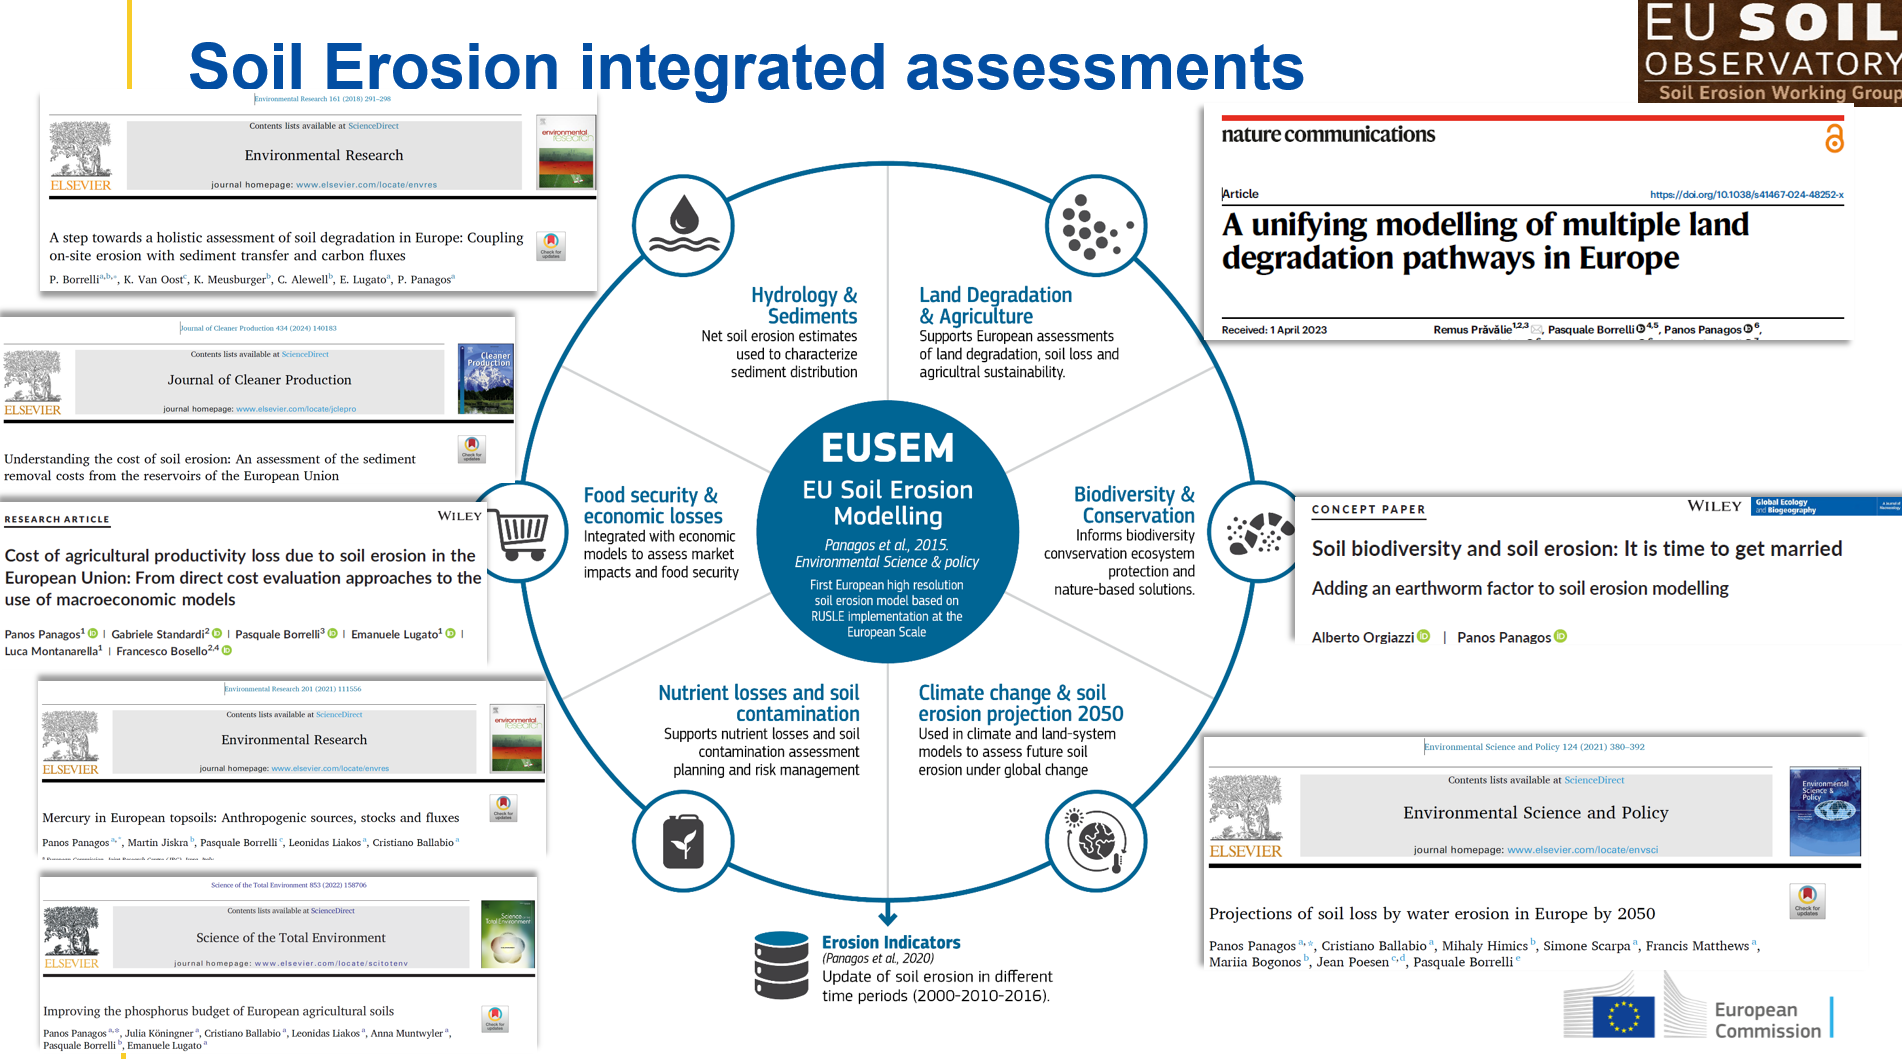
EUSEM - European Soil Erosion Modelling Platform
To address the policy developments (Common Agricultural Policy, Soil Monitoring Law, SDGs) and the emerging scientific challenges, the EU Soil Observatory (EUSO) continues to further develop the EU Soil Erosion Modelling (EUSEM) Platform, which advances our understanding of soil erosion in the EU. In additionm EUSEM provides better spatio-temporal estimates of soil erosion to support policies such as the Soil Monitoring Law, Common Agricultural Policy, and Sustainable Development Goals (SDGs). EUSEM is designed to provide a comprehensive framework for assessing soil erosion and support the effective strategies for conservation. The integration of soil erosion assessments with other processes allows the further development of EUSEM with studies on a) Hydrology & Sediments b) Land Degradation & Agriculture c) Biodiversity & Conservation d) Climate change and soil erosion projections e) Nutrient losses (as carbon and/or Phosphorus) f) soil contamination and fluxes of contaminants g) Food security and economic losses.The collaboration in the EU Soil Observatory (EUSO) Working Group on soil erosion is a key factor to develop such integrated assessments.
References
Panagos, P., Ballabio, C., Himics, M., Scarpa, S., Matthews, F., Bogonos, M., Poesen, J., Borrelli, P., 2021. Projections of soil loss by water erosion in Europe by 2050. Environmental Science & Policy, 124: 380-392.
Panagos, P., Borrelli, P., Robinson, D.A. Common Agricultural Policy: Tackling soil loss across Europe. Nature 526, 195 (07 October 2015), doi:10.1038/526195d
Panagos, P., Borrelli, P., Poesen, J., Ballabio, C., Lugato, E., Meusburger, K., Montanarella, L., Alewell, .C. 2015. The new assessment of soil loss by water erosion in Europe. Environmental Science & Policy. 54: 438-447. DOI: 10.1016/j.envsci.2015.08.01
Panagos, P., Ballabio, C., Poesen, J., Lugato, E., Scarpa, S., Montanarella, L. and Borrelli, P., 2020. A soil erosion indicator for supporting agricultural, environmental and climate policies in the European Union. Remote Sensing, 12(9): 1365.
Borrelli, P., Robinson, D.A., Fleischer, L.R., Lugato, E., Ballabio, C., Alewell, C., Meusburger, K., Modugno, S., Schütt, B., Ferro, V., Bagarello, V., Oost, K.V., Montanarella, L., Panagos, P. 2017. An assessment of the global impact of 21st century land use change on soil erosion. Nature Communications, 8(1), art. no. 2013
Panagos, P., Imeson, A., Meusburger, K., Borrelli, P., Poesen, J., Alewell, C. 2016. Soil Conservation in Europe: Wish or Reality? Land Degradation and Development, 27 (6): 1547-1551
Panagos, P., Ballabio, C., Borrelli, P., Meusburger, K., Klik, A., Rousseva, S., Tadic, M.P., Michaelides, S., Hrabalíková, M., Olsen, P., Aalto, J., Lakatos, M., Rymszewicz, A., Dumitrescu, A., Beguería, S., Alewell, C. Rainfall erosivity in Europe. Sci Total Environ. 511 (2015), pp. 801-814. DOI: 10.1016/j.scitotenv.2015.01.008
Panagos, P., Meusburger, K., Ballabio, C., Borrelli, P., Alewell, C. (2014) Soil erodibility in Europe: A high-resolution dataset based on LUCAS. Science of Total Environment, 479–480 (2014) pp. 189–200
Panagos, P., Borrelli, P., Meusburger, C., Alewell, C., Lugato, E., Montanarella, L., 2015. Estimating the soil erosion cover-management factor at European scale. Land Use policy 48C: 38-50. , doi:10.1016/j.landusepol.2015.05.021
Panagos, P., Borrelli, P., Meusburger, K. 2015. A New European Slope Length and Steepness Factor (LS-Factor) for Modeling Soil Erosion by Water. Geosciences, 5: 117-126
Panagos, P., Borrelli, P., Meusburger, K., van der Zanden, E.H., Poesen, J., Alewell, C. 2015. Modelling the effect of support practices (P-factor) on the reduction of soil erosion by water at European Scale. Environmental Science & Policy 51: 23-34
Go Back To
") |
Title: Net erosion and sediment transport using WaTEM/SEDEM (for EU) | |
|
Resource Type: Datasets, Soil Threats Data Theme/Sub-Theme: Erosion by water, Europe (Baseline), Sediment transport using WaTEM/SEDEM Registration requested: Request Form |
Continent: Year: 2018 Keywords: RUSLE2015; Topographic factor; Sediment distribution; net soil loss; sediment deposition |
|
") |
Title: Soil erosion by water (RUSLE2015) | |
|
Resource Type: Datasets, Soil Threats Data Theme/Sub-Theme: Erosion by water, Europe (Baseline), Soil Erodibility in Europe, Rainfall Erosivity in Europe, Cover Management Factor, Support Practices Factor, Slope Length and Steepness factor (LS-factor) Registration requested: Request Form |
Continent: Year: 2015 Keywords: RUSLE, soil erodibility, rain erosivity, Management practices, agricultural sustainability, policy scenarios |
|