You are here
Satellite-based Global R-factor
We used the high spatial and temporal resolution global precipitation estimates obtained with the National Oceanic and Atmospheric Administration (NOAA) Climate Data Record (CDR) Climate Prediction Center MORPHing (CMORPH) technique. Such high spatial and temporal (30 min) resolution data have not yet been used for the estimation of rainfall erosivity on a global scale. Alternatively, the erosivity density (ED) concept was also used to estimate global rainfall erosivity. The obtained global estimates of rainfall erosivity were validated against the pluviograph data included in the Global Rainfall Erosivity Database (GloREDa). Overall, results indicated that the CMORPH estimates have a marked tendency to underestimate rainfall erosivity when compared to the GloREDa estimates. The most substantial underestimations were observed in areas with the highest rainfall erosivity values.
At the continental level, the best agreement between annual CMORPH and interpolated GloREDa rainfall erosivity maps was observed in Europe, while the worst agreement was detected in Africa and South America. Further analyses conducted at the monthly scale for Europe revealed seasonal misalignments, with the occurrence of underestimation of the CMORPH estimates in the summer period and overestimation in the winter period compared to GloREDa. The best agreement between the two approaches to estimate rainfall erosivity was found for fall, especially in central and eastern Europe. Conducted analysis suggested that satellite-based approaches for estimation of rainfall erosivity appear to be more suitable for low-erosivity regions, while in high erosivity regions (>1000–2000 MJ mm ha-1 h-1 yr-1) and seasons, the agreement with estimates obtained from pluviographs (GloREDa) is lower. Concerning the ED estimates, this second approach to estimate rainfall erosivity yielded better agreement with GloREDa estimates compared to CMORPH, which could be regarded as an expected result since this approach indirectly uses the GloREDa data. The application of a simple linear function correction of the CMORPH data was applied to provide a better fit to GloREDa and correct systematic underestimation. This correction improved the performance of CMORPH, but in areas with the highest rainfall erosivity rates, the underestimation was still observed. A preliminary trend analysis of the CMORPH rainfall erosivity estimates was also performed for the 1998–2019 period to investigate possible changes in the rainfall erosivity at a global scale, which has not yet been conducted using high frequency data such as CMORPH. According to this trend analysis, an increasing and statistically significant trend was more frequently observed than a decreasing trend.
The CMORPH product is a reprocessed and bias-corrected global precipitation data set covering the area between the 60_ S and 60_ N parallels, with a 30 min time step and a spatial resolution of 8 km_8 km. The CMORPH data are developed by the National Oceanic and Atmospheric Administration (NOAA) and cover the period from 1998 onwards. Since CMORPH provides an estimate of the 30 min precipitation, each 30 min rainfall rate was assumed to be constant during this time interval. GloREDa was created with the objective of developing the first ever global rainfall erosivity map using high temporal resolution data. GloREDa contains annual rainfall estimates for 3625 stations from 63 countries with temporal resolution ranging from 1 to 60 min.
Model: In order to calculate the annual and monthly rainfall erosivity for each grid cell that is covered by the CMORPH product, the time series with a 30 min time step were extracted from the original CMORPH data set. For each grid cell covered by CMORPH, a 30 min precipitation time series (mm h-1) was extracted for the 1998–2019 period. The erosive events were defined according to the procedure described in the RUSLE handbook.
The Erosivity Density (ED) concept was first introduced by Kinnell (2010) and was also used in the scope of the enhanced RUSLE approach, named RUSLE2, which led to the improvements in rainfall erosivity mapping. The ED is defined as the ratio between annual or monthly rainfall erosivity and annual or monthly precipitation. Thus, ED is calculated as the ratio of rainfall erosivity (R) and rainfall depth (P).
ERA5 is one of the latest reanalysis products produced by the European Centre for Medium-Range Weather Forecasts (ECMWF) that provide atmospheric, land-surface, and seastate data. ERA5 includes a large number of historical observations and provides a long-term solution for ED estimation. The reanalysis data combine the model data and observations across the globe into a complete and consistent data set based on the laws of physics.
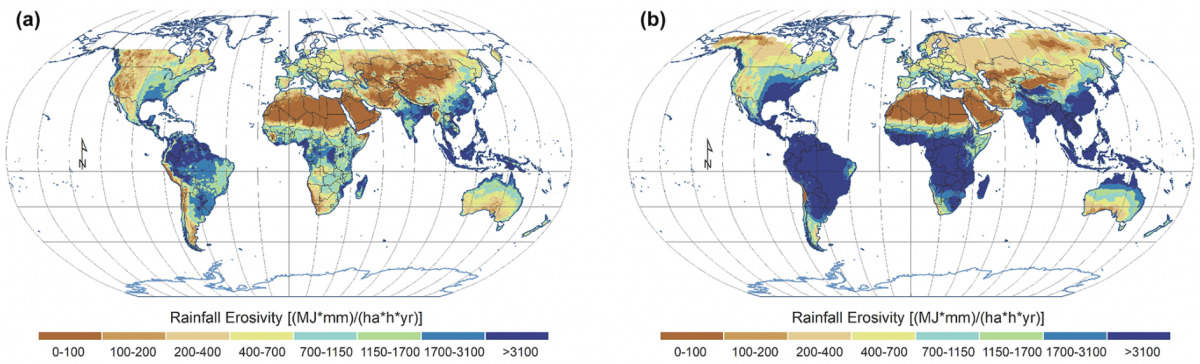
Mean global rainfall erosivity map for the 1998–2019 period based on the CMORPH product (a) and ED concept using ERA5 (b).
Data: You can donwload the data based on CMORPH and ED concept in the same directory as the Global Rainfall Erosivity.
Reference: Bezak, N., Borrelli, P. and Panagos, P., 2022. Exploring the possible role of satellite-based rainfall data in estimating inter-and intra-annual global rainfall erosivity. Hydrology and Earth System Sciences, 26(7): 1907-1924.
Results:
The CMORPH product leads to a marked underestimation of annual rainfall erosivity across the globe, with an average value of 1.53 times lower than the GloREDa station-based rainfall erosivity. The agreement between CMORPH and GloREDa estimates varied significantly among continents and climatic zones. While the best agreement was detected for Europe (i.e., percent bias around 10 %), on average, it has relatively low-erosivity values, and a considerably lower performance was observed for Africa and South America (i.e., percent bias around −60 %). Besides having a higher average rainfall erosivity value than Europe, these regions also suffer from a considerably lower number of measurement stations in the GloREDa database.
Despite the mentioned shortcomings and strong underestimation of the rainfall erosivity in some parts of the globe, the satellite-based precipitation products tend to be an interesting option for the estimation of the rainfall erosivity, especially in regions with limited ground data. However, in some regions and seasons, such products require additional correction to remove bias, which is of course related to the availability of ground-based precipitation. Thus, it is clear that such ground-based high-frequency precipitation measurements are (still) essential for accurate rainfall erosivity estimates; however, one can expect that technological development in the next decades will lead to improved accuracy of satellite-based products such as CMORPH. These kinds of products could be used as an input to the dynamic soil erosion models, which could be used by relevant stakeholders. At the moment, alternative approaches such as the ED concept can provide more accurate rainfall erosivity estimates, which can be computed more easily.
Go Back To
 |
Title: Global Rainfall Erosivity | |
|
Resource Type: Datasets, Soil Threats Data Theme/Sub-Theme: Erosion by water, Global Rainfall Erosivity, Future Global Rainfall Erosivity in 2050 and 2070, Satellite-based Global R-factor, Rainfall Erosivity in Europe Registration requested: Request Form |
Continent: Country: Ispra Italy Author: Panos Panagos, Cristiano Ballabio Year: 2017 Publisher: European Commission, Joint research Centre Language: EN Keywords: erosion, erosivity |
|
|
|
||